
Events in clinical narratives are naturally associated with medical trials, including surgery, vaccination, lab test, medication, medical procedure, and diagnosis. They are interrelated with many temporal relations. The grouping of medical events onto temporal clusters is a key to applications such as longitudinal studies, clinical question answering, and information retrieval. However, it is difficult to define clinical event quantitatively or consistently in coarse time-bins (e.g. before vaccination or after admission). In this article, I developed the K-means classifier to enable labeling a sequence of medical events with predefined time-bins. The features set is based solely on temporal distance similarity between boundaries of events. The result of the solution is integrated with the KnightLab timeline JS tool.
In this article I investigate the task of tagging a sequence of events using a clustering algorithm. For this purpose I assume that each medical note can be associated with a predefined set of coarse of times that I refer to as time bins. For our example of VAERS note, the potential time-bins are: “before vaccination”, “soon after vaccination”, and “way after vaccination”. The time-bin “before vaccination” is intended to capture past medical history of the patient including the medical state of the patient on time of vaccination; “soon after vaccination” captures medical events that occurred immediately after the vaccination; and “way after vaccination” captures medical events that occurred after an extended duration from the vaccination. The issue in clustering events in predefined time-bins is that the time duration of each timebin varies based on the patient. For instance, the coarse of time “soon after vaccination” could be the first few hours after or a few days after depending on the general conditions. For that I consider that related events happen in relatively close proximity of time. I use a non-hierarchical clustering to classify the set of events. I consider the temporal distance between events as the measure of similarity between events of same clusters and dissimilarity between events of different clusters.
K-Means Clustering
K-means is one of the simplest algorithms for solving the clustering problem. Clustering is an unsupervised learning problem whereby I aim to group subsets of entities with one another based on a temporal distance similarity. The idea is to define k centroids for the k assumed clusters and to associate each point belonging to a given data set to the nearest center. A point represents the time instant of the event or the center of interval if its time interval event. When no point is pending, the first step is completed and an early group age is done. At this point I re-calculate k new centroids as barycenter of the clusters resulting from the previous step. After I have these k new centroids, I re-bind the same data set points to their nearest new center. A loop has been generated. As a result of this loop the k centers change their location step by step until no more changes are done or in other words centres do not move any more.
Timeline View
For data that relates to temporal events, the Timeline Widget adds an interesting dimension to your exhibit.
The nobelists.js data file lists the years when the Nobelists won their prizes, so I can plot each one on a time line. To display timelines in Exhibit you need to include a separate utility, the Timeline widget. The Timeline widget is a bit bulky, so Exhibit doesn't include it by default. You have to include the time extension to Exhibit. Open the file nobelists.html, find the reference to exhibit-api.js and add the following script element after it:
<div data-ex-role="view">
    data-ex-view-class="Timeline"
    data-ex-start=".time"
    data-ex-end=".time2"
    data-ex-color-key=".cluster"
    data-ex-top-band-unit="month"
    data-ex-bottom-band-unit="year"
    data-ex-top-band-pixels-per-unit="90"
    data-ex-bottom-band-pixels-per-unit="400"
        <div data-ex-role="lens">
                <span data-ex-content=".hour"></span>:
                <span data-ex-content=".label"></span>
        </div>
</div>
Visualization
I visualize the results using the Exhibit dashboard
solution. The timeline dashboard enables intuitive cluster analysis
by user interactions. Also our visualization allows summarizing by
the various types of events information. 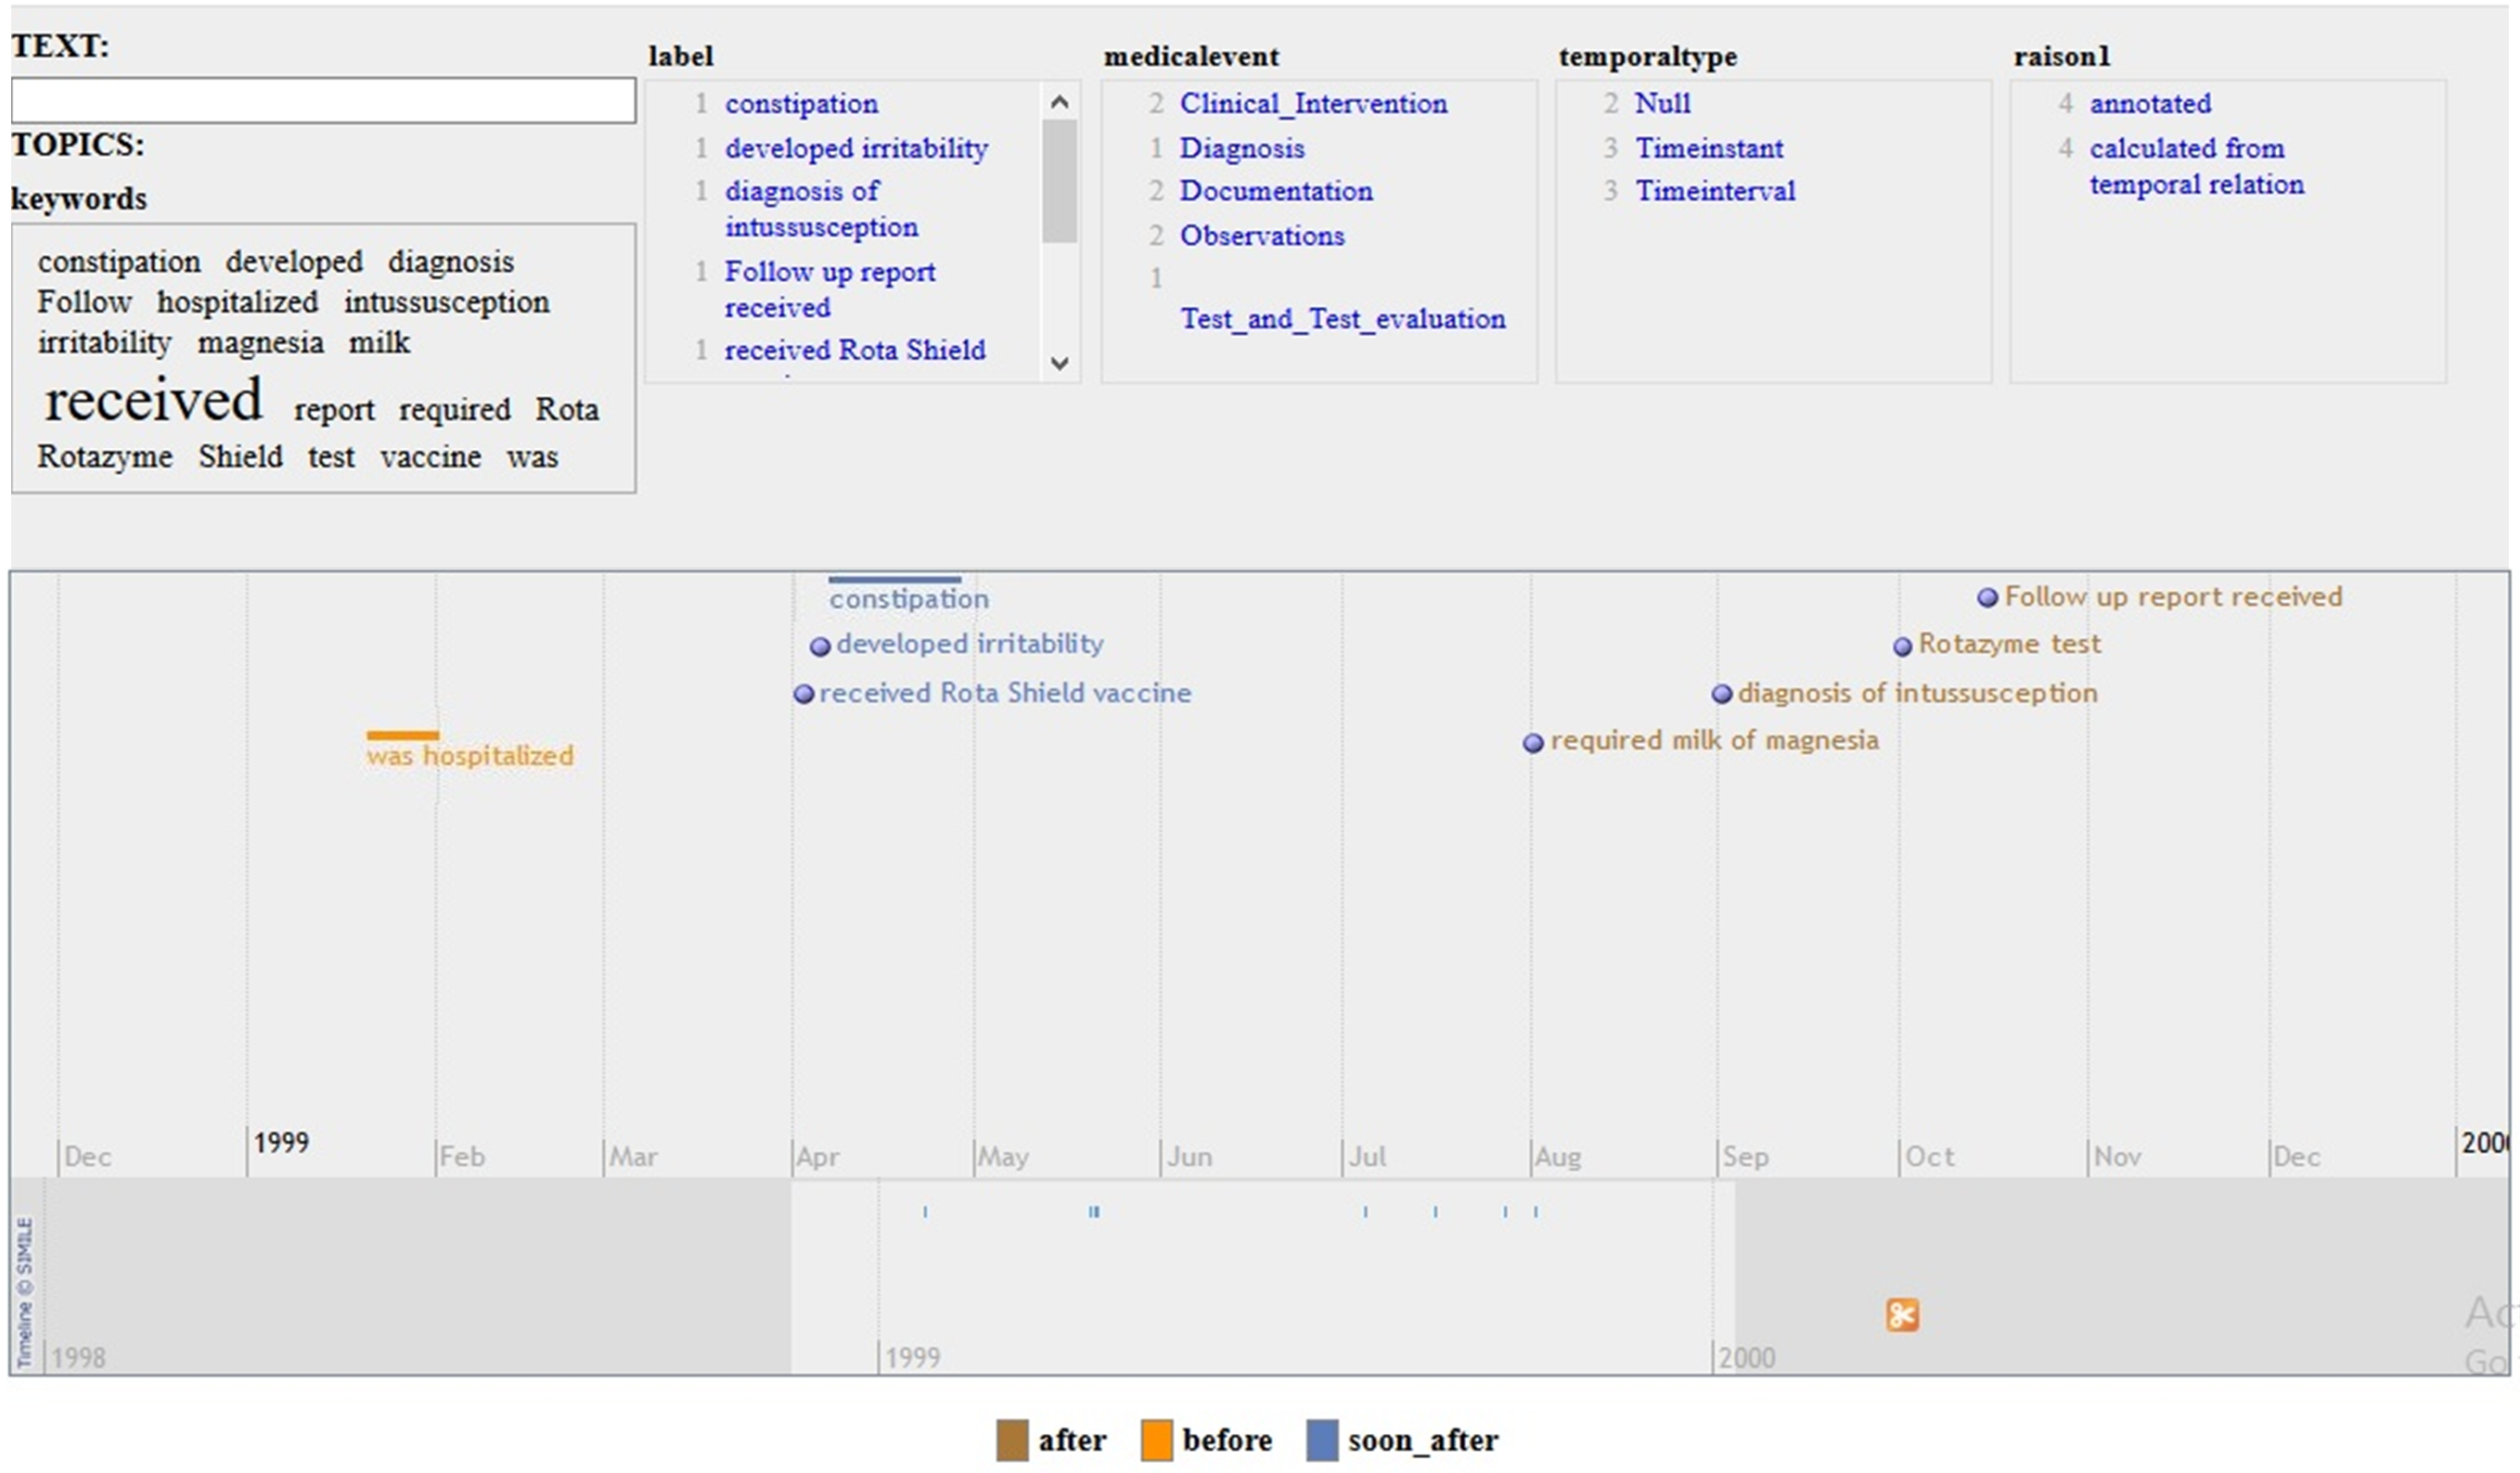 Check out the visualization of clustered events
comments powered by Disqus